Check your proxy traffic, balance and API usage: video guide
A 0:55 screen recording with voice and captions of the three places of the QuanticData dashboard that show what you use: My proxies and the Usage card of a plan, the balance in the top bar with its history of top-ups, and Usage and Logs with requests, billed amount, free usage, the split by tool and the CSV export.
Every price in writing: Pricing: APIs per result, proxies per GB.
Chapters
Transcript
The captions of the video, line by line. Click a time to jump there.
- 0:00Proxy traffic, balance and API usage, all in your dashboard. Here is where to look.
- 0:06My proxies lists every plan, with the traffic left.
- 0:10Click a plan to open it.
- 0:12The Usage card shows what remains, and what you have used.
- 0:16The expiry date is at the top, next to Add bandwidth.
- 0:20Your balance is always in the top bar.
- 0:22Add credit opens the balance page, with what is available and what you have spent.
- 0:28Balance History lists every top-up.
- 0:31Usage and Logs covers the Data API.
- 0:34Three cards: requests, what was billed, and your free usage.
- 0:38Below, requests are split by tool.
- 0:41And the daily table shows each day.
- 0:44Switch the period, or export the table as CSV.
- 0:50Prices for every product are at quanticdata.io/pricing.
Where to go next
One balance for proxies and web data
A prepaid balance pays for proxy plans and API usage, a failed request is never billed, and all prices are published on the pricing page.
More video guides
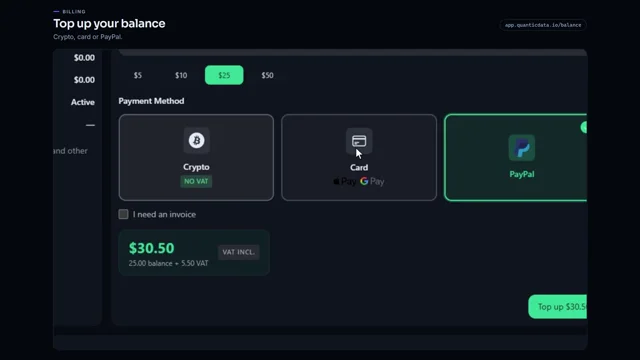 0:54Add credit to your balanceWatch the video
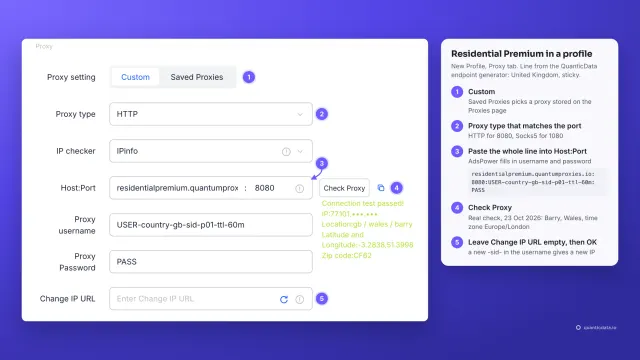 1:34How to add a proxy to AdsPowerWatch the video
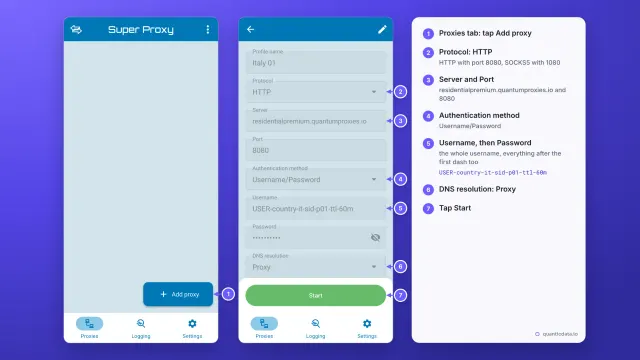 1:33How to set up a proxy on AndroidWatch the video
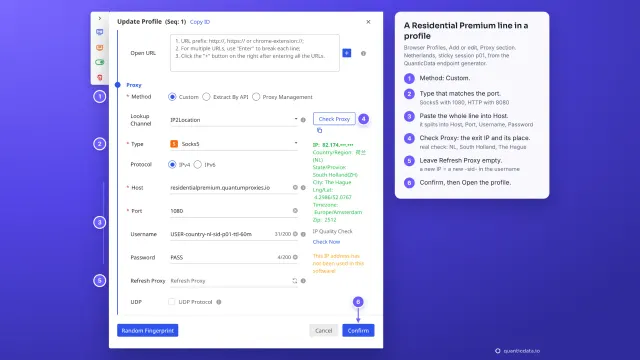 1:35How to add a proxy to BitBrowserWatch the video
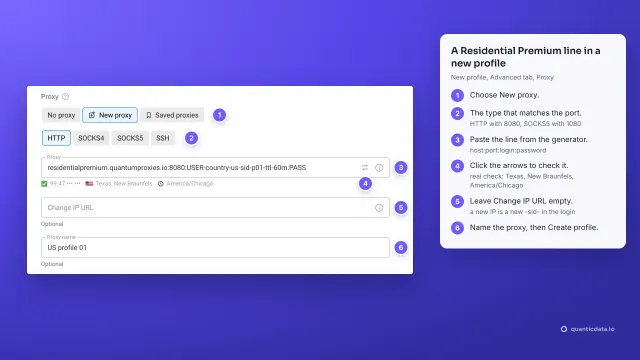 1:37How to add a proxy to Dolphin AntyWatch the video
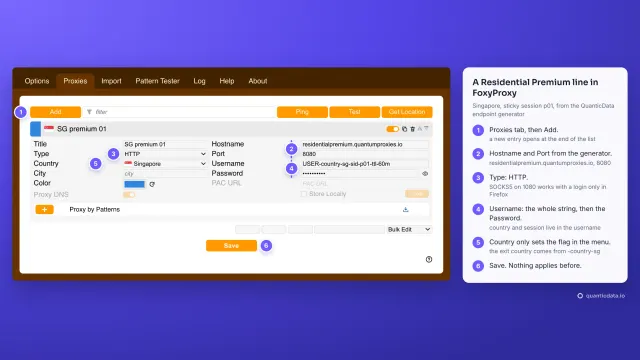 1:40How to add a proxy to FoxyProxyWatch the video