Technographic data is the record of which technologies a company uses: its CMS or store platform, analytics, ad pixels, payments, email marketing, chat and hosting. Sales and marketing teams use it to find companies whose stack fits what they sell. On 20 November 2026 we collected it for 18 store sites in one run.
Most pages about technographics define the term and stop. This one shows the data: the collector call, the rows that came back, and the Python that turns 94 detections into adoption rates and a list of prospects. Every number below comes from that run.
What technographic data contains
A technographic record is one company and the tools it runs. A good record says what was found, where it was found and how sure the detection is. The fields usually fall into a handful of groups.
| Group | Examples | Where it shows up |
|---|---|---|
| Platform | Shopify, WordPress, Drupal, Magento | Script addresses, the generator meta tag, page markup |
| Front-end framework | Next.js, Nuxt, Angular, jQuery | Script bundles and page markup |
| Analytics and tags | Google Tag Manager, Microsoft Clarity, GA4 | Tag scripts and their account ids |
| Marketing | Klaviyo, ad pixels, consent managers | Third-party scripts loaded by the page |
| Payments and chat | Klarna, PayPal, Gorgias | Widgets on the page |
| Infrastructure | Cloudflare, Vercel, Netlify, nginx | HTTP response headers |
Technographic data sits next to firmographic data, which describes the company itself: industry, size, location, legal entity. Firmographics tell you whether a company could buy. Technographics tell you whether your product fits the way it already works.
How technographic data is collected
There are four common sources, and each sees a different part of the stack.
- Website scanning. Fetch a page and match signatures: script addresses, HTML patterns, the
generatormeta tag that the HTML standard defines for the software that produced the page, and response headers such asServer. It is current to the minute. - Job postings. A company hiring for a platform is investing in it. Job boards are a good signal for internal tools a website never shows.
- Public code and registries. Repositories, package manifests and DNS records (an MX record names the email provider) show tools behind the website.
- Bought databases. Vendors combine the three above and resell the result. Coverage is wide, but you rarely see when a row was last checked.
The run below uses the first source, which is the one you can check yourself: open the site, view the source, and the detection is there.
The run: 18 store sites on 20 November 2026
We profiled 18 well-known direct-to-consumer brand sites with our tech stack collector. The collector fetches each homepage once and matches more than 90 signatures across the HTML, script addresses, the generator tag and the response headers. We called it from Claude through the QuanticData MCP server:
run_collector {
  "slug": "tech_stack",
  "input": {
    "domains": ["allbirds.com", "warbyparker.com", "glossier.com", "casper.com",
                "everlane.com", "brooklinen.com", "awaytravel.com", "ruggable.com",
                "...", "olaplex.com"]
  },
  "async": true
}
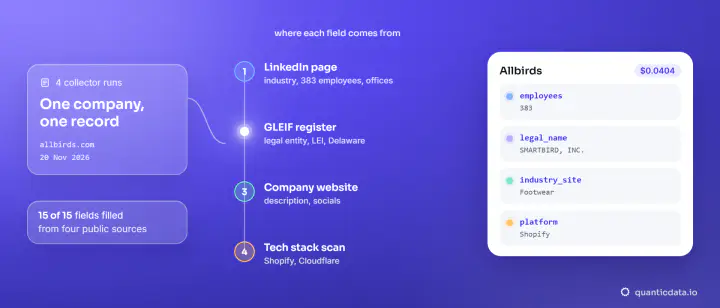
Each delivered row carries the site, a list of detections and a count. This is part of the row for allbirds.com, as returned:
{
  "domain": "allbirds.com",
  "ecommerce_platform": "Shopify",
  "analytics": ["Google Tag Manager", "Microsoft Clarity"],
  "cdn": "Cloudflare",
  "tech_count": 5,
  "technologies": [{ "name": "Shopify", "category": "ecommerce", "confidence": "high", ... }, ...]
}
Every detection also has a confidence level: high when a response header, the generator tag or a script address names the technology, medium when a single pattern in the page source does. At the published price of $0.005 per site, the 18 sites cost $0.09, inside the $2 of free API usage every account gets each month.
From rows to adoption rates and a segment, in Python
The run returns an id, so a script can pick up the rows later without running the collector again. This is the script we ran, with pandas, on the same day:
import os, requests, pandas as pd

RUN_ID = "YOUR_RUN_ID"  # the run_id returned by run_collector
API = "https://api.quanticdata.io/v1/scraper/collectors/runs/"
headers = {"Authorization": f"Bearer {os.environ['QUANTICDATA_API_KEY']}"}
rows = requests.get(API + RUN_ID, headers=headers, timeout=60).json()["payload"]["results"]

# one row per site and technology
tech = pd.DataFrame(
    [{"domain": r["domain"], "name": t["name"], "category": t["category"]}
     for r in rows for t in r["technologies"]]
)
sites = tech["domain"].nunique()
print(f"{sites} sites, {len(tech)} detections, {tech['name'].nunique()} technologies\n")

# adoption: share of sites using each technology
adoption = (tech.groupby(["category", "name"])["domain"].nunique()
            .sort_values(ascending=False).rename("sites").reset_index())
adoption["share"] = (adoption["sites"] / sites * 100).round().astype(int).astype(str) + "%"
print(adoption.head(12).to_string(index=False), "\n")

# a technographic segment: Shopify stores with Klaviyo and no chat widget
stack = tech.groupby("domain")["name"].apply(set)
chat = set(tech.loc[tech["category"] == "chat", "domain"])
segment = [d for d, s in stack.items()
           if "Shopify" in s and "Klaviyo" in s and d not in chat]
print("Shopify + Klaviyo, no chat widget detected on the homepage:", len(segment), "stores")
And its output:
18 sites, 94 detections, 22 technologies

 category               name  sites share
      cdn         Cloudflare     17   94%
ecommerce            Shopify     16   89%
 security           hCaptcha     10   56%
analytics Google Tag Manager     10   56%
    email            Klaviyo      6   33%
    other           OneTrust      5   28%
    fonts       Google Fonts      4   22%
    fonts        Adobe Fonts      3   17%
framework            Next.js      3   17%
     chat            Gorgias      3   17%
 payments             Klarna      3   17%
      cdn             Vercel      2   11%

Shopify + Klaviyo, no chat widget detected on the homepage: 4 stores
What the 18 sites tell you
Even a small sample reads like a market map. Shopify runs 16 of the 18 stores; the other two are warbyparker.com on Next.js and purple.com on Drupal. Cloudflare fronts 17 of them. Google Tag Manager is on 56%, Klaviyo on a third. Three sites load a Gorgias chat widget and three offer Klarna.
| Question a seller asks | Answer from the run |
|---|---|
| How many prospects are on my platform? | 16 of 18 on Shopify (89%) |
| Who already uses my category? | 3 sites with a chat widget, 6 with Klaviyo |
| Who uses the tool mine integrates with, but not mine? | 4 Shopify stores with Klaviyo and no chat widget detected on the homepage |
| Who runs a custom front end? | 3 sites on Next.js |
The last line of the output is the useful part. A company selling a support chat app for Shopify that syncs with Klaviyo gets four stores that fit the integration and show no chat widget on the homepage. On a list of 5,000 domains the same three lines of pandas run unchanged, and the collection costs $25 at the same rate per site.
Technographic segmentation that holds up
A segment is only as good as the detections under it. Three habits keep it honest.
- Keep the confidence and the date. A detection from a header or a script address is solid; a single pattern in the page is a hint. Stacks change, so store the collection date next to every row and re-run before a campaign.
- Join on the domain. The domain is the key that links technographics to company data, contacts and CRM records. Normalise it first: lowercase, no www, no path.
- Segment on combinations, not single tools. "Uses Shopify" describes most of the market. "Uses Shopify and Klaviyo but no chat" describes a sales angle.
For the cleaning steps between raw rows and a segment, see our guide to data wrangling in Python. For what to do with the list afterwards, see how to build a B2B lead list and finding B2B clients from public data.
Build it or buy a technographic database?
A bought database is fast when you need millions of companies across many signals, including internal tools no website reveals. Collecting it yourself is better when you have your own list of domains, need today's stack rather than last quarter's, and want to see how each detection was made. You pay per site that comes back, and the rows join straight onto your CRM by domain.